The Dynamic Golden Butterfly Portfolio is a modern evolution of a classic strategy. While the traditional Golden Butterfly is hailed as the perfect balance between risk and reward, we believe that in today’s shifting markets, a more active approach is required to maximize performance.
But here’s the catch: markets don’t stand still. As we discussed in the previous article, the decades ahead may not be as favorable for Lazy Portfolios as the two decades behind.
Why Start With the Golden Butterfly?
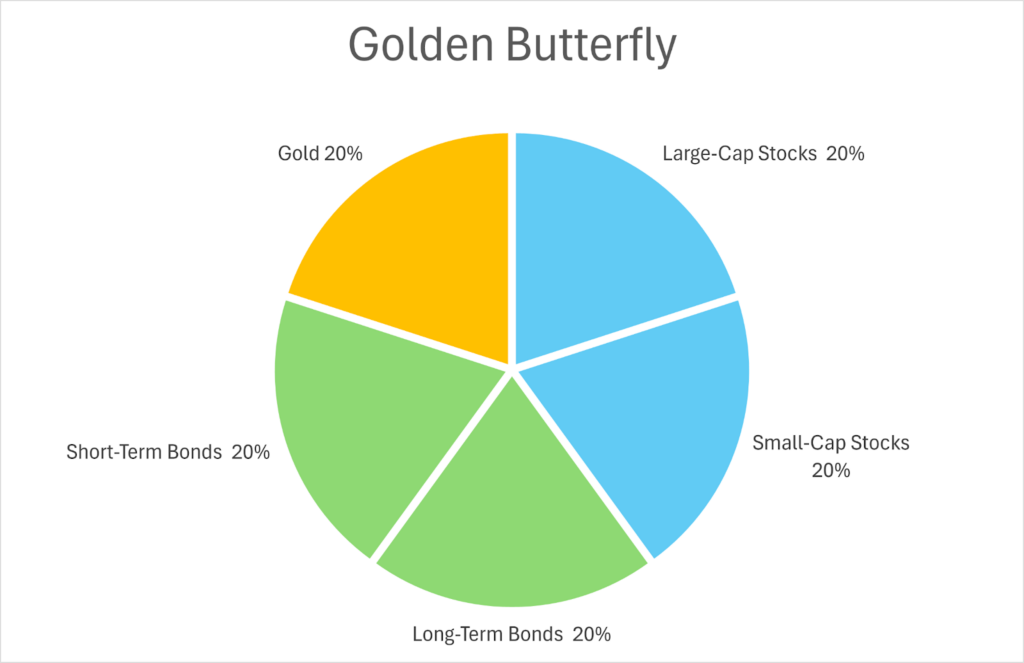
The Golden Butterfly is a great foundation because:
– It mixes growth assets (large-cap and small-cap stocks).
– It includes safe havens (long-term bonds, short-term bonds or cash).
– It diversifies into gold, a classic crisis hedge.
For years, this mix provided a smoother ride than just stocks, while still offering meaningful returns. But as we’ve seen, static allocations are struggling in today’s market environment.
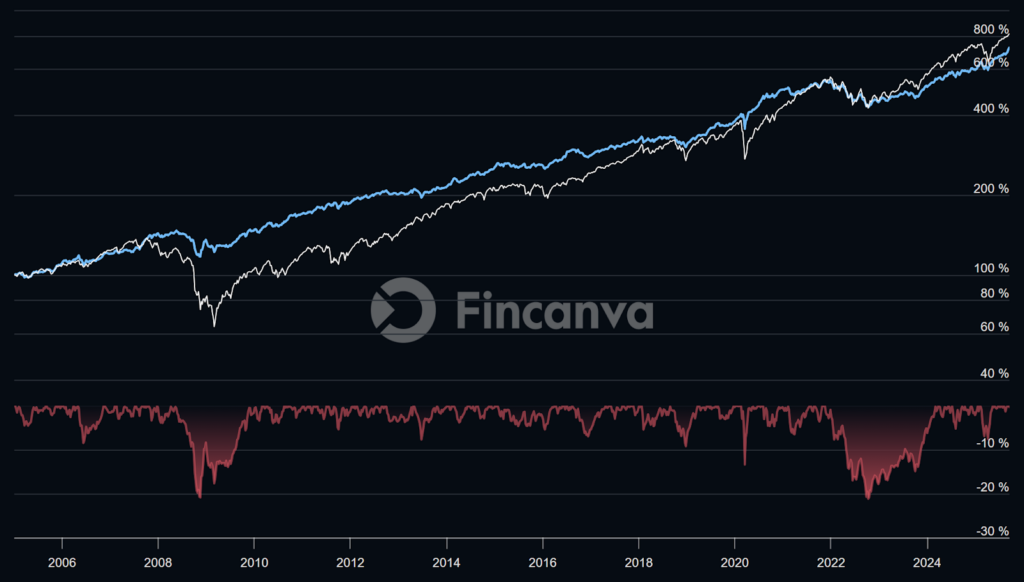
Golden Butterfly vs. S&P 500: A Sustainability Check
We’ll start by looking at the growth charts.
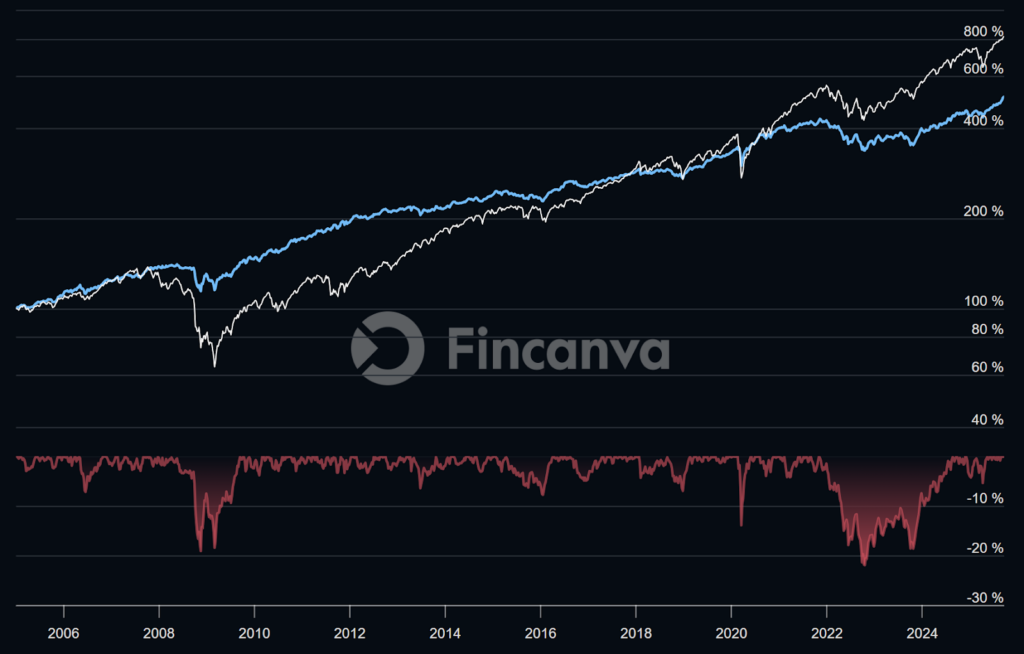
As it’s clear from the equity lines, the S&P 500 achieves more growth — but it does so at the cost of much greater risk. Let’s quantify this trade-off with a few key metrics:
| Metric | Golden Butterfly | S&P 500 |
| CAGR | 8.2% | 10.6% |
| Max Drawdown | -22.9% | -55.2% |
| Standard Deviation | 9.1% | 18.9% |
| Sharpe Ratio | 0.71 | 0.47 |
Comment
The CAGR confirms what we expected: the S&P 500 delivered stronger returns (10.6% vs. 8.2%). But the story changes once we account for risk and sustainability.
– Max Drawdown shows how costly those returns were: a -55% collapse versus just -23% for the Golden Butterfly. That difference can decide whether an investor stays invested or bails out.
– Standard Deviation highlights volatility: the benchmark was twice as erratic (18.9% vs. 9.1%).
– Sharpe Ratio puts it all together: the Golden Butterfly rewarded investors far better per unit of risk (0.71 vs. 0.47)
In other words, the lower return of the Golden Butterfly is more than compensated by its sustainability. It grows slower, but it grows steadier, and that steadiness is what allows compounding to actually work.
Making it a Dynamic Golden Butterfly Portfolio
The Golden Butterfly is solid, but it raises a question: can we make it more efficient, capturing more return without giving up its resilience? The answer is yes, by adding adaptability and making its wings dynamic. Here’s what that looks like in practice:
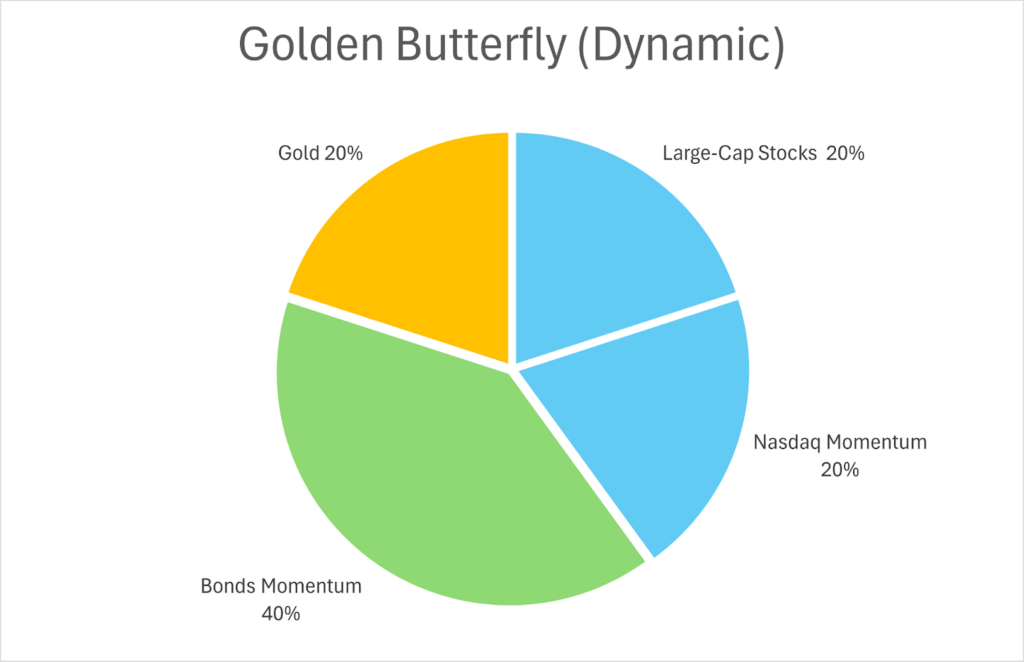
1. Equity Side: Instead of a fixed 40% in stocks, split it into:
– 20% momentum strategy on Nasdaq 100.
– 20% allocation to large-caps stocks (S&P 500).
This way, you’re leaning into strength instead of being locked into the same positions.
2. Bond Side: Replace static bonds with a momentum rule between:
– TLT (long-term Treasuries).
– TIP (Inflation-Protected bonds).
This gives you flexibility depending on whether rates or inflation dominate.
3. Gold stays unchanged.
How the Momentum Logic Works
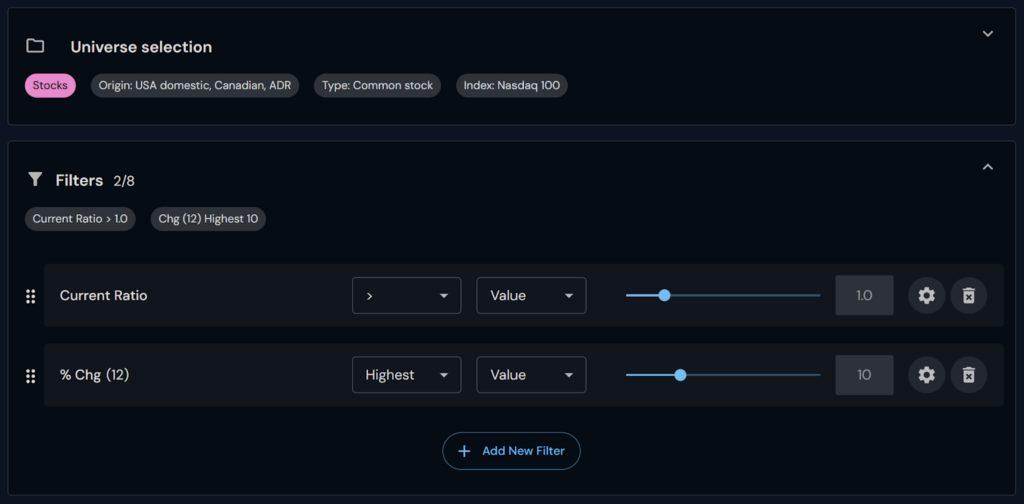
The equity momentum strategy on the Nasdaq 100 is built using a simple but effective screener:
– Current Ratio > 1.0: ensures we avoid companies with shaky balance sheets — no “garbage stocks.”
– % Chg(12) Highest 10: selects the 10 strongest performers over the previous 12 months, keeping us invested in leaders.
This rule guarantees exposure to 10 stocks at any given time, always rotating into strength. Here is a screenshot of this simple screener:
For the bond side, the logic is even simpler:
– % Chg(12) Highest 1: here, we only compare two ETFs (TLT vs. TIP) and invest in whichever had the best 12-month performance. No first line is needed, since we’re choosing between two ETFs instead of two stocks.
Dynamic Golden Butterfly Portfolio vs. S&P 500: Balancing Growth and Risk
We’ll start again by looking at the growth charts.
From the equity lines, it’s clear: the Dynamic Golden Butterfly not only keeps pace with the S&P 500 in terms of growth, it does so while containing risk far more effectively. In practice, this means investors get nearly the same upside — but without enduring the devastating drawdowns and nerve-shredding volatility of the benchmark. It’s proof that by introducing adaptability into a portfolio structure, we can preserve performance while making the journey smoother and more sustainable.
Let’s quantify this trade-off:
| Metric | Golden Butterfly (Dynamic) | S&P 500 |
| CAGR | 10.0% | 10.6% |
| Max Drawdown | -22.0% | -55.2% |
| Standard Deviation | 9.8% | 18.9% |
| Sharpe Ratio | 0.85 | 0.47 |
Comment
The CAGR shows that the Dynamic Golden Butterfly delivered almost the same growth as the S&P 500 (10.0% vs. 10.6%). But the real story lies in risk:
– Max Drawdown was less than half that of the S&P 500 (-22% vs. -55%), keeping losses far more manageable.
– Standard Deviation was also cut nearly in half (9.8% vs. 18.9%), making the ride much smoother.
– Sharpe Ratio improved significantly (0.85 vs. 0.47), showing that each unit of risk taken was rewarded almost twice as efficiently.
In short: the Dynamic Golden Butterfly captures nearly all the upside of the benchmark, but with dramatically better sustainability.
Why a Dynamic Portfolio Structure Matters
The difference isn’t just cosmetic. By making the portfolio dynamic, you allow it to:
– Adapt to market cycles (growth vs. inflationary periods).
– Reduce dead weight (avoiding assets stuck in long slumps).
– Preserve diversification while still pursuing stronger returns.
In other words, we’ve successfully harnessed the low-risk advantages of the classical Golden Butterfly, without giving up the return potential of a pure equity exposure.
Building Your Dynamic Golden Butterfly Portfolio with Fincanva
This is exactly the kind of challenge Fincanva was built for. On the platform you can:
– Design any Lazy Portfolio from scratch, whether it’s the Golden Butterfly, All Weather, or any custom portfolio of which you want to test the performance.
– Adapt and refine portfolios to fit your financial goals, adjusting allocations, adding rules, or introducing new asset classes, and a lot more.
– Compare performance with ease, thanks to an incredibly detailed output.
– Work faster, powered by our highly optimized, high-speed simulation engine that crunches decades of data in milliseconds.
– Backtest with depth, using screeners based on technical, fundamental, or macroeconomic factors to refine strategies across equities, ETFs, or even crypto.
With Fincanva, you don’t just see the end result, you explore the why behind portfolio performance, and you can adapt any idea into a version that fits today’s markets and your personal goals.
Final Thought
The Golden Butterfly remains one of the best choices for investors who want a portfolio that’s simple, easy to follow, and easy to invest in. Its balance and accessibility are what made it such a classic.
But with Fincanva, we’ve shown how its performance can be taken a step further. By adding a layer of adaptability and momentum, we were able to improve the results and even surpass the performance of the S&P 500, all while keeping the structure relatively simple.
And this is just one example. With Fincanva you’re not limited to testing and refining old ideas, you can design, test, and bring to life entirely new portfolio strategies, expressing your own creativity while grounding every choice in data and empirical evidence.